 This fall, I’m sending three kids to Elementary school. In person. In a pandemic.
The whole family is excited for a taste of normalcy. Yet, part of me wonders: am I crazy? Is this too risky?
Here in Vancouver, case numbers are far higher than they were in June, when schools re-opened during a blissful few weeks of single digit new cases. Are the current numbers too high?
According to our beloved public health leader, Dr. Bonnie Henry, “It’s going to be okay”. While I trust our leaders to make sensible choices for the broader population, I want a deeper understanding of my family’s risk equation.
To do this, I’ve become a serious COVID-19 sleuth. I closely monitor our COVID-19 dashboard, study the advice of public health experts, read the latest scientific publications, and watch what’s happening around the world. Even with a deep background in biomedical sciences (PhD genetics), this is a challenging task.
This article shares the information and process that helped me understand the risks involved in sending my kids to school, and highlights some of the factors that will determine how things unfold.
I fully recognize that my risk assessment is far from perfect but I’d rather have soft numbers than rely solely on blind faith.
How can we measure local risk? How low is low?
The single most important determinant of back-to-school risk is what’s happening with COVID-19 in your school community. If there are many cases sneakily circulating in this community, chances are high that someone will show up infected. If there’s very little COVID-19 around, you’re probably in the clear (though never 100%).
To measure the local risk of COVID-19 infection, the Harvard Global Health Institute uses the number of new daily COVID-19 cases per one hundred thousand people (seven day average).
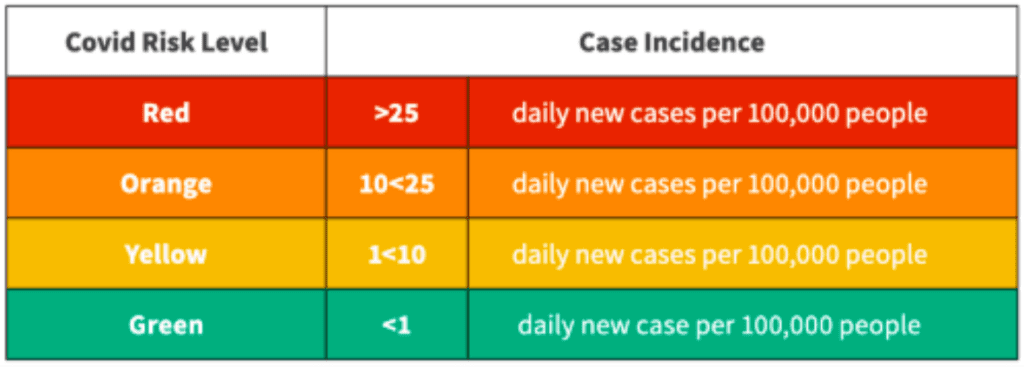
Using this metric, regions can be ranked from lowest to highest risk as “green”, “yellow”, “orange”, or “red” and back-to-school strategies can be tailored according to risk level.
What’s my local risk?
Those in the United States can use an online tool from GlobalPandemics.org to see where their county lands using this metric.
In Canada, the Globe and Mail used this metric to analyze COVID-19 risk for neighbourhoods within five Canadian cities (Calgary, Edmonton, Ottawa, Montreal and Toronto) and reported that every area was either “green” or “yellow” (with the exception of a small section of Edmonton — as of Aug 28, 2020).
Since Vancouver wasn’t part of the analysis, I turned to publicly available COVID-19 data. With a few rough calculations, I came up with approximately 3 new daily cases per 100,000 for the city of Vancouver.
Show me the data! We had 307 new cases in the city of Vancouver over the last 14 days (Aug 21-Sept 3, 2020). Divide 307 cases/14 days to get 22 cases per day. This means ~3 new daily cases per 100,000 (assuming population of 700,000).
Taken at face value, this daily incidence rate put us in the bottom third of the Yellow Zone using the Harvard Global Health Institute’s framework. It was reassuring to see that BC’s plan aligns well with Yellow Zone guidance:
“Grades preK-8 (and special education services): In person if conditions for pandemic resilient teaching and learning spaces can be achieved at scale.”
“Grades 9–12: Open on a hybrid schedule, with only a subset of students on campus at any particular point of time to facilitate de-densification.”
Note: I presume the cutoff at Grade 9 reflects the fact that high school starts in Grade 9, rather than a distinctly different biological risk.
Do regional COVID-19 case counts tell the whole story?
While the raw COVID-19 case counts provide a useful starting point, they may not accurately reflect the true exposure risk at school. Digging into COVID-19 testing data can help shed light on potential disconnects.
Let’s start with the not-so-good news — the true number of COVID-19 cases across all of Vancouver, and the surrounding areas, is probably somewhat higher than reported.
Here are two reasons to ‘dial up’ the estimated risk:
1: We are likely missing some cases
Short of universal testing, and no travel, our testing data will always be missing some cases. The question is — how many? Based on our robust testing and contact tracing, it seems that we are catching most, but not all, cases.
Show me the data!
* Test positivity rate: 2.5% (Over 3% is concerning); Source: BCCDC COVID-19 Dashboard, Sept 3, 2020;
* Worrisome cases: ~20% of cases are local and unlinked to known clusters. Another 5% are coming in from travel. The lower these numbers, the less we are missing. Source: BCCDC’s surveillance report, Phase 2 and 3 data together, Sept 3, 2020;
2: Case numbers have likely grown (modestly)
Today’s new cases represent people that became infected days or weeks ago; thus, it’s essential to account for recent growth trends. Given that regional case counts have been steadily growing, it’s likely that the true case number today is modestly higher than the data suggest.
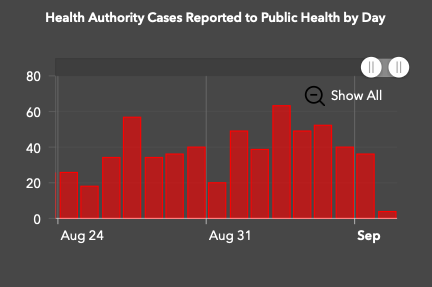
Show me the data! New daily cases have been flat at about 40 per day, which suggests growth is steady, but not steep (BCCDC COVID-19 Dashboard Sept 3, 2020); Our R number / replicative number (RO) was recently estimated to be about 1.2, which means each case infects 1.2 other people. Source: Dr. Bonnie Henry weekly press report (Sept 2, 2020)
Now the good news — the infection rates of those showing up to school may be considerably lower than regional averages.
Here are three reasons to ‘dial down’ the estimated risk:
1: COVID-19 cases occur in “hotspots”
Cases of COVID-19 are not evenly distributed, yet, by using regional numbers, this is what we are assuming. In reality, infection rates are high in “hotspots” (e.g. a long term care facilities or workplace outbreak), and much lower outside of hotspots. Assuming my children’s school is not well-connected to a hotspot, it’s likely that the community infection rate is lower than the regional average.
BC COVID-19 insights: “About one-third of cases being seen now are related to events like parties, clubs and nightclubs. Another third is related to transmission within families. The final third is related to exposure in workplace clusters or outbreaks in long-term care.” News conference, Aug 28, 2020
2: Many COVID-19 cases are isolated early, through contact tracing
If we take case counts at face value, we are assuming that every new case represents somebody who may show up at school sick. Yet, BC has aggressive contact tracing that is flagging and isolating many emerging cases. Thankfully, these people won’t be showing up at school!
Show me the data! From May to September 2020, 58% of cases in BC were part of known outbreaks, while 21% were “unlinked” but local. Another 5% were from travel, while the rest were of unknown origin. As BC ramps up its contact tracing capacity, these numbers will look even better (see hiring press release Aug, 2020).
3: Infection rates are lower in school-age children
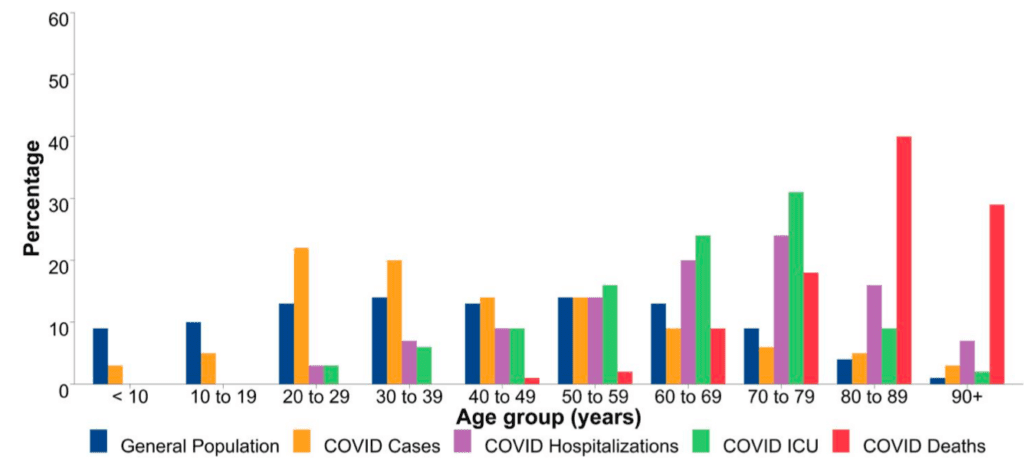
COVID-19 cases infection rates often vary greatly across different age groups. In the under ten age group (where my three kids sit) COVID-19 infection rates are significantly lower than the general population average. The opposite is true of the 20s-40s age group (see chart). Even if we assume some missed cases due to lack of testing, these lower rates are reassuring.
Show me the data! In the last two weeks, we have seen 14 cases in the under 10 age group out of 504 cases in Vancouver Coastal Health or about 3% ( BCCDC case data, Aug 21-Sept 3, 2020). The data across the entire pandemic in all of BC tell a similar story (157 cases under age 10 out of 5980 total cases).
Where do all the caveats leave us?
Considering the mix of good and bad news above, my best guess is that the COVID-19 exposure situation in my school community is not far from where this analysis started— around 3 new cases daily per 100,000 people.
While this number helps to confirm our “Yellow Zone” status, it doesn’t directly address the big question on my mind:
How likely is it that somebody shows up to school carrying COVID-19?
To answer this question, I used the total reported number of new cases per 100,000 over the last two weeks. For a pod size of 100, this translates to about a 4% chance of being exposed to COVID-19. A pod size of 50 would cut this in half, while a pod of 200 would double it. As somebody with three kids in school, these figures look concerning, at first glance. Size really matters!
Show me the data! 44 per 100,000 based on 307 cases in the city of Vancouver over two weeks divided by 700,000 students (BCCDC Surveillance report, Aug 21-Sept 3, 2020). This is about 1 case per 2300 kids.
Note: This is the same approach used by the New York Times team for “The Risk That Students Could Arrive at School With the Coronavirus” (July 31, 2020) and is described by the University of Texas COVID-19 Modeling Consortium.
Fortunately, getting exposed is not the same as getting infected, and getting infected is not the same as getting sick. While the precise transmission risk is unknown, and warrants its own article, the risk is likely very low, for the following reasons:
(1) We know how to mitigate transmission risk. Around the world, we have seen transmission rates plummet when risk-mitigation measures are implemented (e.g. physical distancing, ventilation, masks). The vast majority of reported transmissions are happening in high-risk contexts: households, high density indoor social gatherings (parties and bars), and long-term care facilities. (2) Nobody at at school should be symptomatic. Lack of symptoms definitely does not guarantee lack of transmission, but it helps a lot. (3) Several studies of infected children in high-risk situations have reported low transmission rates. For example, this study in South Korea reported than only 5% ( 3 of 57) of household contacts of COVID-19 positive kids became infected. Another study, from early in the outbreak in Wuhan, reported that only 11% of household contacts became infected (across all ages).
Of course, I’m also factoring in the health of my kids. Because my children don’t have any pre-existing conditions, the most likely outcome, by far, is mild to no illness. If this weren’t the case, my math would be very different.
My Bottom Line
I don’t think I’m crazy to send my kids to school in a pandemic — at least my local slice of it. We live in a Yellow Zone. Opening schools, with ample precautions, makes sense.
For my family, our exposure risk is small, our chances of infection are tiny, and our chances of health consequences are minuscule. For us, this risk is worth the vast benefits to mental, social, and emotional wellbeing for our family— not to mention the actual learning.
My biggest worries are the potential for community transmission, to vulnerable people like my parents, and the challenges of a stop-start school year.
If we send thousands of kids back to school, we will see kids showing up at school with COVID-19. It’s a matter of when, and where, not if. Yet, if we play our cards right, these cases don’t have to turn into outbreaks, either in schools or communities.
I’m confident that we can get through this next season with our physical and emotional health intact – if we all step up. We need schools to get their risk mitigation measures right so that those rare infected kids don’t infect others, including teachers and administrators. We need students and staff to adhere to risk-mitigation strategies, and to be mindful of their exposures outside of school. We need to invest in ramping up our testing capacities so that entire families don’t have to stay home for two weeks at every runny nose. We need to continue extensive contact tracing so that cases are rapidly identified and isolated. Last, but not least, all of us who are exposed, through schools, need to take measures to protect the broader community.
Additional resources:
There is no one right choice for each family. Check out this back-to-school decision making tool by Maven Clinic & Prof Emily Oster to help think through your situation.